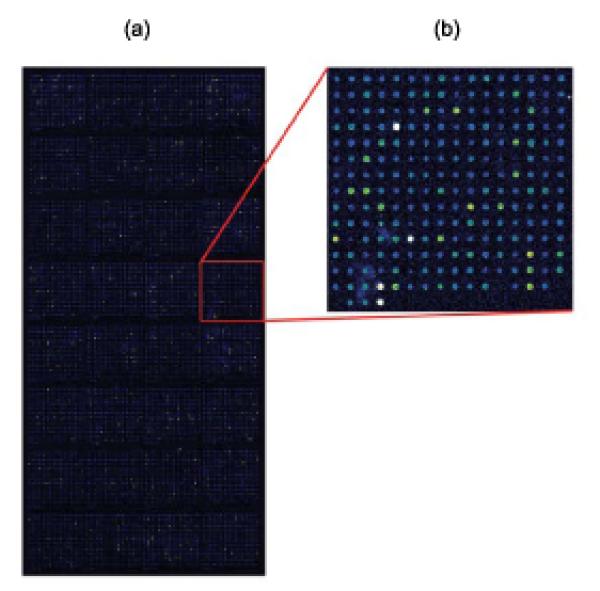
Figure 2. Example of a PBM in which a GST-tagged yeast TF was bound to a whole-genome yeast intergenic microarray printed with PCR products.

(a) Whole-genome yeast intergenic microarray bound by Rap1. The fluorescence intensities of the spots are shown in false-color, with white indicating saturated signal intensity, red indicating high signal intensity, green indicating moderate signal intensity, and blue indicating low signal intensity. (b) Zoom-in on a portion of the whole-genome yeast intergenic microarray bound by Rap1. (Reproduced from [26] with permission from Nature Publishing Group.)
