
Figure 5. Identification of the DNA binding site motif from the significantly bound spots.
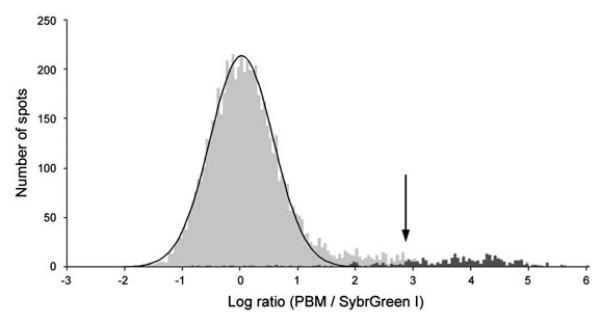
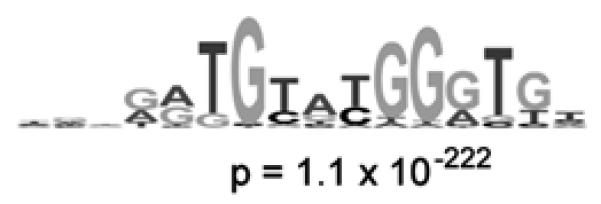
(a) Distribution of ratios of PBM data, normalized by SYBR Green I data, for the yeast TF Rap1 bound to yeast intergenic microarrays. The arrow indicates those spots passing a P-value cutoff of 0.001 after correction for multiple hypothesis testing. Indicated in dark gray are spots with an exact match to a sequence belonging to the PBM-derived binding site motif. (b) Sequence logo [53] of the PBM-derived motif for the yeast TF Rap1. (Reproduced from [26] with permission from Nature Publishing Group.)