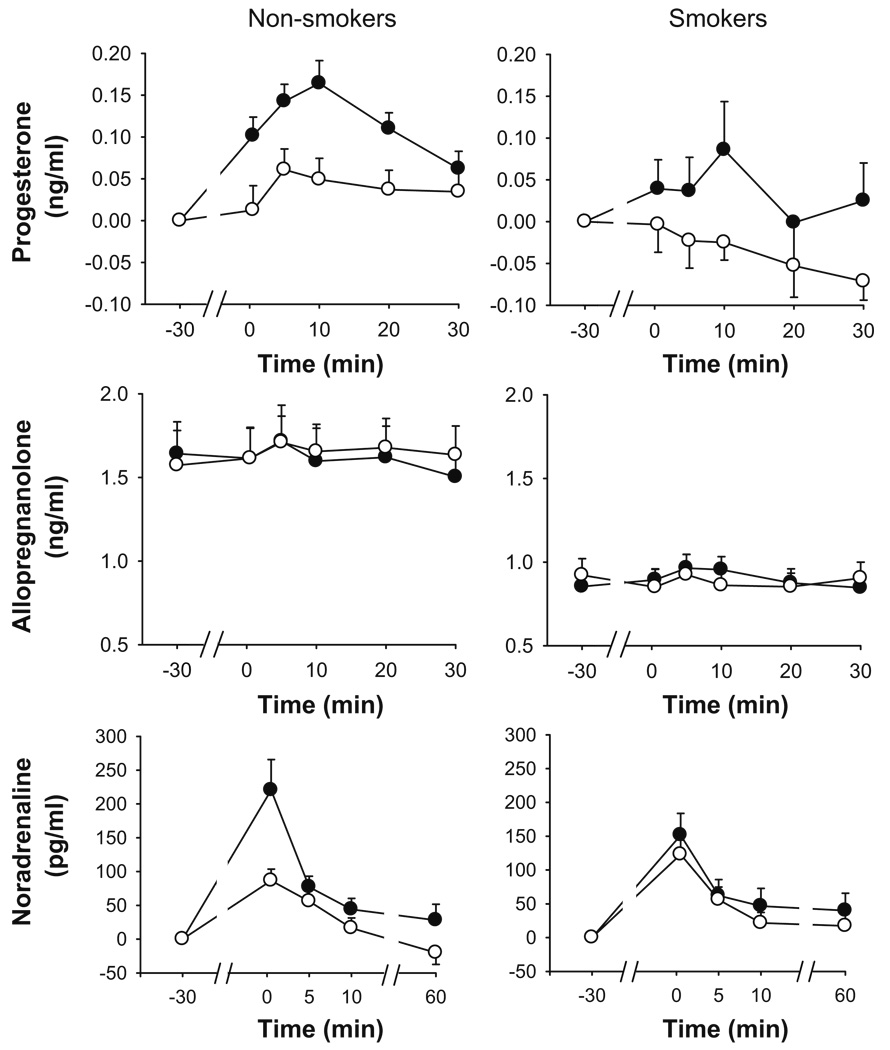
Fig. 4.
Changes in plasma hormones after the TSST (filled symbols) and control tasks (open symbols). Data represent mean±SEM (1) change from pre-task baseline for progesterone and noradrenaline, (2) absolute values for allopregnanolone, across time in min after completion of the tasks (task preparation from −20 to −10 min; task performance from −10 to 0 min)

