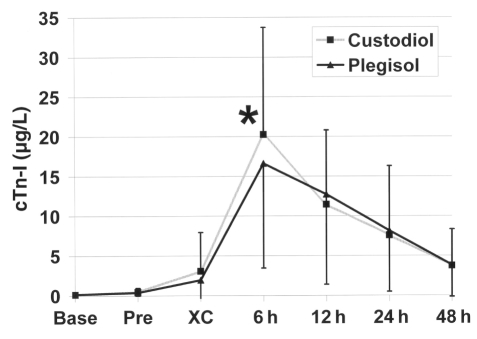
Figure 1).
Time course of cardiac troponin I (cTn-I) release. The graph shows the expected peak of cTn-I release at 6 h (*P=0.01), which is the only statistically different time point. Base indicates the time of study registration, typically the day before surgery; Pre indicates immediately before incision; XC Cross-clamp release

