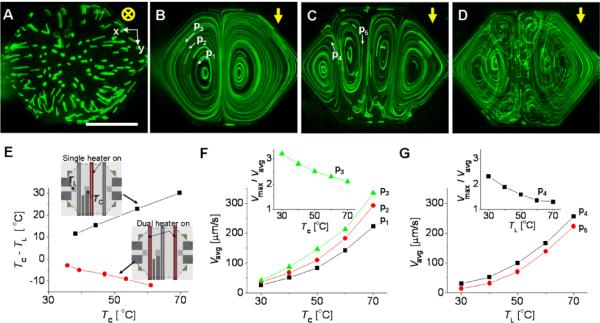
Figure 2.

Natural convection-driven flows in the chamber. (A to D) Flow trajectories of fluorescent microparticles taken for 35 s. Measured maximum temperatures, Tmax, in A to D are 52, 51, 46, and 50°C, respectively. The yellow arrows indicate the gravity direction, and the white arrows depict the flow direction of the individual fluorescent particles of 8 μm diameter. The single heater is turned on in A and B and the dual heater is turned on in C. The single and dual heaters are alternatively turned on and off in D. To see the vertical image of B to D, we used a 45° inclined mirror (Supporting information, Figure S8) (E) Temperature gradient in the chamber. TC and TL are the fluid temperatures measured at the temperature sensors of the center and the left of the chamber-region, respectively. (F and G) Flow speed of the fluorescent microparticles in B and C. The single heater is turned on in F and the dual heater is turned on in G. Vavg is the flow speed averaged over the individual microparticles in a single loop, whereas Vmax is the maximum flow speed for the same loop. The height of the chamber is 180 μm. Scale bar, 1 mm.
