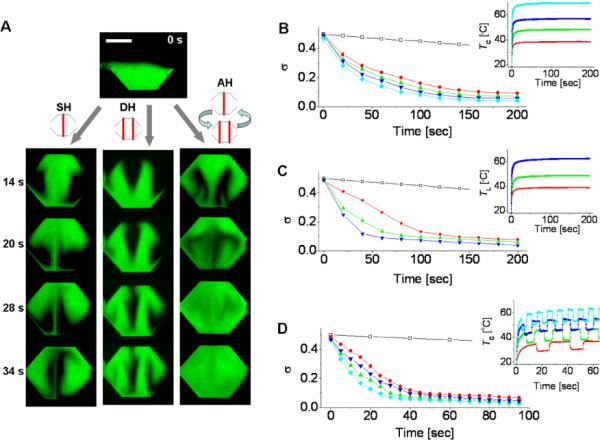
Figure 3.

Micromixing performance in different heating modes. (A) Time evolution of micromixing in the single heating (SH), dual heating (DH), and alternating heating (AH) modes. The values of Tmax are 57, 48, and 56°C in the SH, DH, and AH modes, respectively. (B to D) Time variation of the standard deviation, σ, from the measurement of fluorescent intensity. Shown are data for the SH mode in B, the DH mode in C, and the AH mode in D. The unmixed and perfectly mixed cases are set by σ = 0.5 and σ = 0, respectively. The insets show the fluid temperatures measured using the sensors in Figure 2E (TL or TC). Their line colors correspond to those in the σ vs time plots. For comparison, data for micromixing purely due to diffusion are shown with the points (□). Scale bar, 1 mm.
