
Fig. 2.
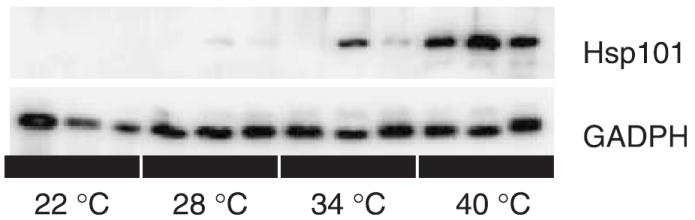
A Western blot illustrating the variation in band optical density between temperatures and genotypes. Top panel: comparison of Mt-0, Lc-0, and Est-1 at four induction temperatures probed with antibodies against Arabidopsis Hsp101. Bottom panel: the same blot probed with antibodies against GAPDH, used to normalize the data.