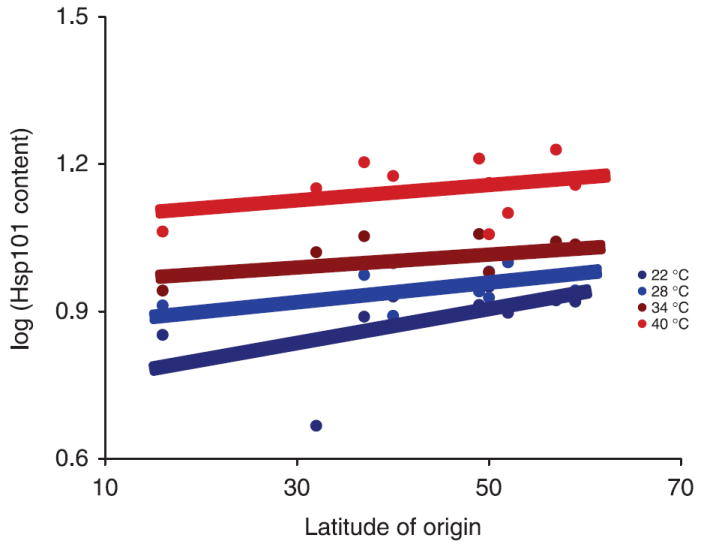
Fig. 3.

The effect of latitude of origin on Hsp101 content for four induction temperatures. Lines are the result of regression using sas proc nlin using this model: genotypic mean log(Hsp101 content) = αeθ(latitude of origin). (For regression analysis results see Table 6).
