
Fig. 6.
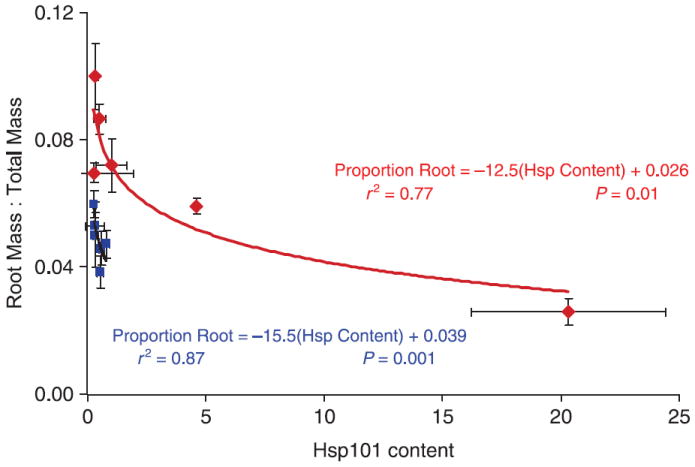
Mean root mass: total mass ratio as a function of Hsp101 content for six replicates of six genotypes of Arabidopsis thaliana (Col-0, Colhot1-3, Ler-2, Lerhot1-3, Mt-0 and Sha), contrasted for two growth conditions: a 15/23 °C control treatment (blue) vs. control treatment plus ~3 h 3 days/week at 35 °C (red). Curves are the Hsp101 exponential decay functions for the two treatments based on sas proc nlin using this model: root : total mass = κ + eα(Hsp content). κ = lowest mean root : total mass ratio observed. Values for the estimated parameters accompany the function curves; details of the analysis are presented in Table 5.