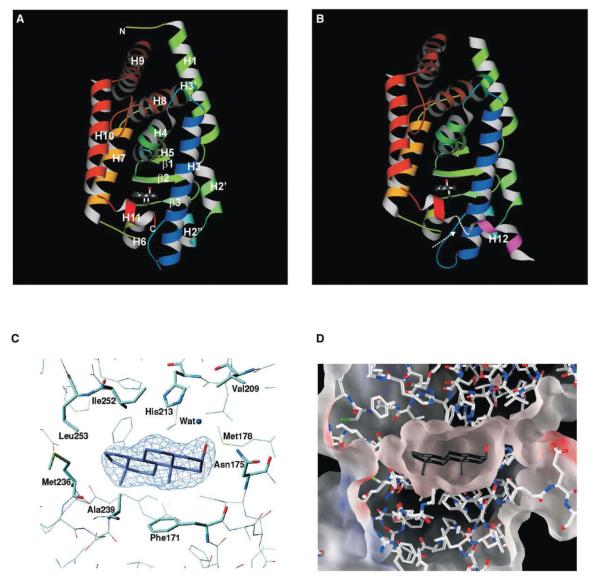
Figure 1.
Structure of mCAR LBD/Androstenol Complex
(A and B) Ribbon representation of each CAR molecule within the asymmetric unit. The arrow indicates the region of missing density between helices H11 and H12 in molecule B. The bound ligand is also displayed in each molecule as ball-and-stick representations.
(C) Fo-Fc omit map contoured at 5σ for androstenol within the binding pocket. The model is superimposed on the electron density, and the androstenol is colored blue (carbon) and red (hydroxyl).
(D) Electrostatic surface representation of the ligand binding pocket. Androstenol is shown in black (carbon) and red (hydroxyl).

