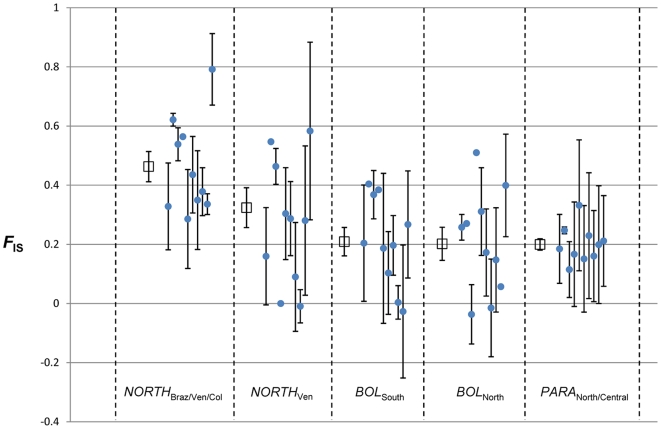
Figure 4. Mean F IS values per syntenous sequence fragment (SSF) across five TcIIc populations.
Error bars represent standard error about the mean. Open squares represent mean F IS across all SSFs in each population. Closed circles represent mean F IS per SSF. Missing error bars correspond to SSFs containing only a single variable locus. NORTH Ven was defined from NORTH Braz/Ven/Col to examine the effect of excluding outlying isolates in order to minimise intrapopulation subdivision.

