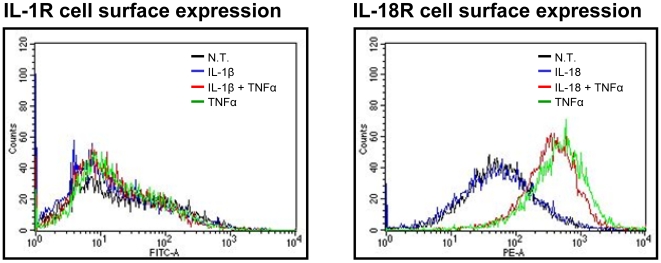
Figure 5. Effect of TNFα treatment on KG-1 IL-18R and IL-1R surface expression.
KG-1 cells (106/ml) were incubated with the indicated combinations of rIL-1β, rIL-18, rTNFα (10 ng/ml each) for 24 h. Cells were stained with IL-18R-PE and IL-1R-FITC followed by flow cytometry analysis. Results are representative of 3 separate experiments.

