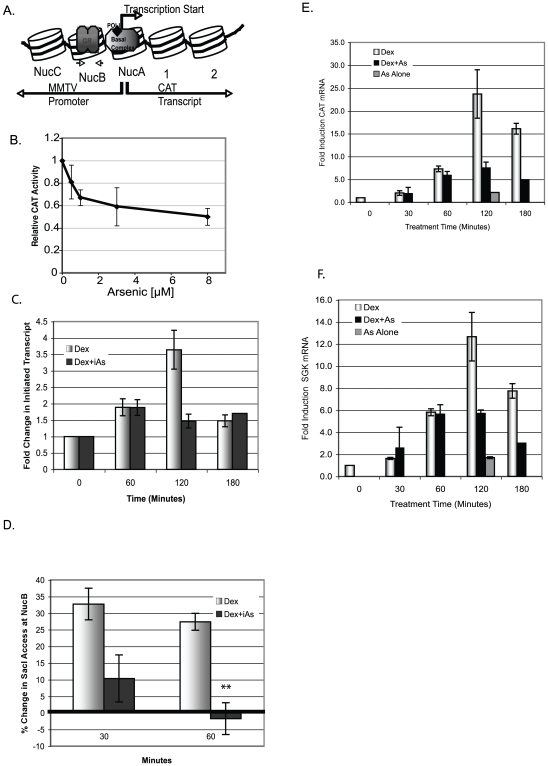
Figure 1. iAs inhibits transcription from the MMTV and SGK promoters.
(A) MMTV promoter with Nucs A–C. Large arrow indicates transcription start site and small arrows, PCR primers in NucB. (B) CAT activity in 1470.2 cells treated (4 h) with 100 nM Dex±iAs. CAT activity expressed as a ratio relative to cells treated with 100 nM Dex alone (arbitrarily set at 1). n = 3 replicates in a representative experiment. (C) Nuclear run-on analysis from the MMTV promoter in cells treated with 5 nM Dex±8 µM iAs for times indicated. Fold change = (CAT mRNA hybridized- background (pUC))/5s RNA) relative to basal transcription (no treatment) arbitrarily set to one. n = 3 replicates from two independent experiments. (D) REAA with restriction enzyme Sac1. SacI-digested DNA from cells treated for 30 or 60 min with 5 nM Dex±8 µM iAs indicates an “open” or “closed” chromatin template at MMTV NucB measured by qPCR with primers that span the SacI site in NucB. The zero value represents basal SacI digestion to which all treated values were compared. n = 3 independent experiments. **P-value<0.01. (E & F) CAT or SGK mRNA measured by qRT-PCR. Cells treated with 5 nMDex±8 µM iAs for times indicated. Both (E&F) are data from the same experiment done in triplicate that is representative of 2 independent experiments.

