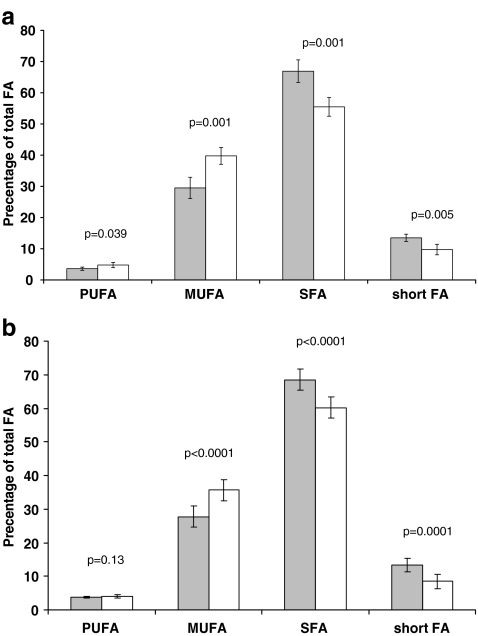
Fig. 2.
Fatty acids profile of milk fat of calorie–protein-restricted lactating beef dams (a) and ketotic dairy cows (b). Gray bars—control group, white bars—CAP stress and ketosis for panel a and b, respectively. PUFA Polyunsaturated fatty acids, MUFA monounsaturated fatty acids, SFA saturated fatty acids, short FA short-chain fatty acids. Lines above bars indicate t-test scores and significances. Results are presented as means ± SD

