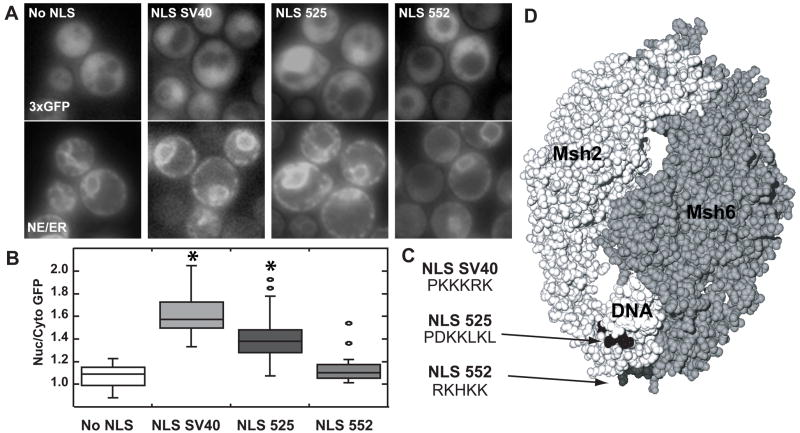
Fig. 2.
Assessing the functionality of Msh2’s putative NLSs. Msh2 putative NLSs starting at codon 525 (NLS 525) and starting at codon 552 (NLS 552) as well as the SV40 NLS (NLS SV40) were each fused in frame to the C-terminus of plasmid encoded triple green fluorescent protein (3xGFP). Triple GFP with no NLS (no NLS) served as a negative control. (A) Representative Images of GFP Nuclear Localization. Using fluorescence microscopy, nuclear localization of 3xGFP was assessed (top panels). Nuclear position was determined using an endoplasmic reticulum/nuclear envelope (ER/NE) fluoresent marker consisting of an endoplasmic reticulum retention sequence fused to cyan fluorescent protein (bottom panels). (B) Quantitative Measurements of Nuclear 3xGFP. The nuclear and cytoplasmic fluorescence of 3xGFP were determined using ImageJ [36]. Box plots of the ratio of nuclear/cytoplasmic fluorescence (Nuc/Cyto GFP) were plotted using Synergy Software KaleidaGraph Version 4.03. The horizontal lines in the boxes indicate the median ratio of nuclear to cytoplasmic GFP in cells of a given strain. The boxes signify the range of values encompassing half of the data. The bars show the range of the entire data set. Individual circles represent outliers. The asterisks indicate the data sets statistically different from the No NLS control. Approximately 50–100 cells were counted for each strain. (C) The amino acid sequences of the NLSs used. The sequences using the single amino acid code for the Msh2 putative NLSs starting at codon 525 (NLS 525) and starting at codon 552 (NLS 552) as well as the SV40 NLS (NLS SV40) are shown. (D) Msh2 putative yeast NLSs map to the DNA binding region of human MutSα. The image is of the MutSα structure [42] with the Msh2 subunit in light grey (left) and the Msh6 subunit in a darker grey (right). The mismatched DNA molecule is in white (DNA). The arrows highlight the putative NLS positions enhanced in black (NLS525) and dark grey (NLS 552). Images were generated by manipulating 208C.pdb [42] using the Swiss PDB Viewer version 3.7 [65] and POV Ray Tracer program, version 3.6.

