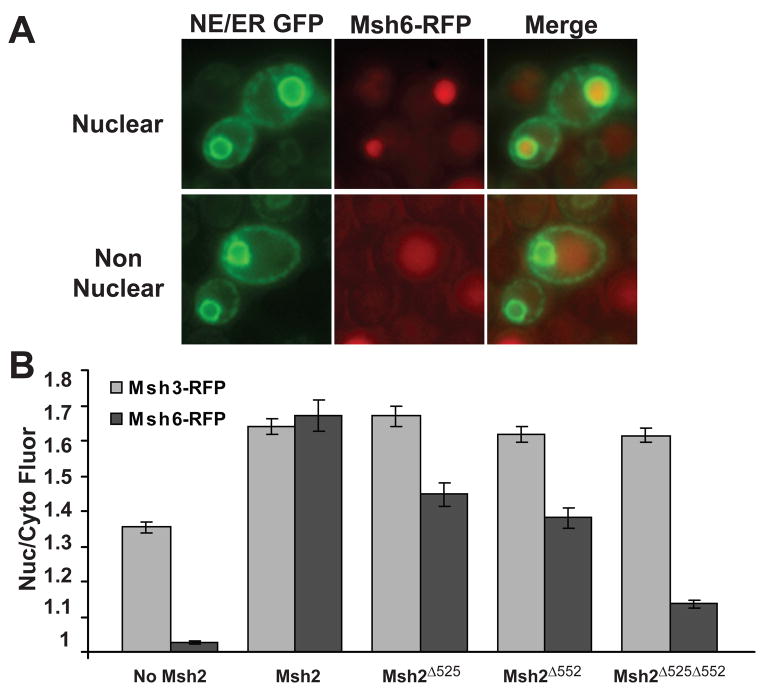
Fig. 5.
Assessment of Msh3 and Msh6 Nuclear localization in the presence and absence of Msh2 and Msh2 NLS variants. Strains expressing Red Fluorescent Protein tagged Msh3 (Msh3-RFP) or Msh6 (Msh6-RFP) were transformed with the nuclear envelope, endoplasmic reticulum triple GFP marker to visualize the nuclei as well as with plasmids expressing no Msh2, Msh2, or Msh2 NLS variants. Specifically, strains msh2Δ MSH6-RFP or msh2Δ MSH3-RFP harboring p3xGFP-HDEL and either pRS413 (no Msh2), pMSH2 (Msh2) or pMSH2-Δ525 (Msh2Δ525), pMSH2-Δ552 (Msh2Δ552), or pMSH2-Δ525Δ552 (Msh2Δ525Δ552) were viewed by deconvolution fluorescence microscopy. (A) Representative images of nuclear localized Msh6-RFP (top panels) and non nuclear Msh6-RFP (bottom panels). Nuclear envelope/endoplasmic reticulum 3xGFP (NE/ER GFP) fluorescence is shown in the left panels. Msh6-RFP fluorescence is shown in the middle panels and a combined image with 3xGFP and Msh6-RFP (Merge) is shown in the right panels. (B) Quantitative Measurements of Nuclear Msh3-RFP and Msh6-RFP. The nuclear and cytoplasmic fluorescence of Msh3-RFP (light grey) and Msh6-RFP (darker grey) were determined using the ImageJ [36]. The ratio of nuclear/cytoplasmic fluorescence (Nuc/Cyto Fluor) is plotted for each strain. The error bars signify the standard error of the mean. Approximately 100 cells were measured for each strain.

