
Figure 4.
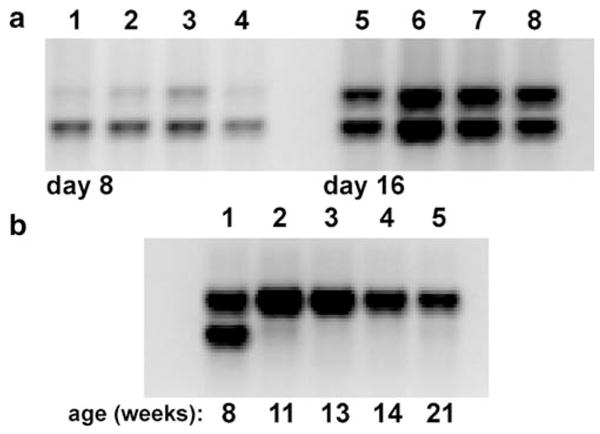
Changes in Wolbachia abundance. a Aa23E cells at passage 17 were seeded in sets of four replicate 35 mm plates at low density in E-20 medium and sampled at 8 and 16 d after plating. The upper band represents Wolbachia DNA amplified by primer pair S12F/S7R; the lower band represents host cell nuclear DNA amplified by S6.97F/S6.560R in the same reaction. b Relative stability of Wolbachia (upper band) and cellular (lower band) DNA as a function of weeks in culture, without passage.