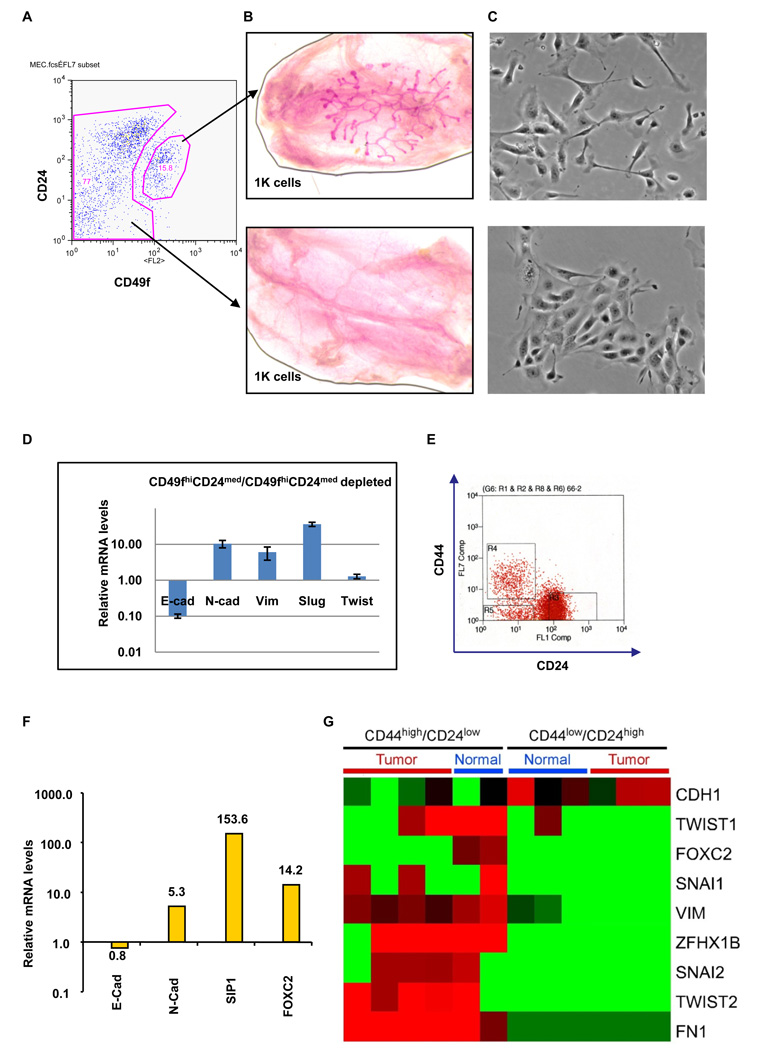
Figure 4.
Primary mouse mammary stem cells, normal human breast stem-like cells, and neoplastic human breast stem-like cells express markers associated with EMT. (A) Primary mouse mammary epithelial cells were separated into CD49fhigh/CD24med and CD49fhigh/CD24med-depleted populations using FACS. (B) A representative image of a cleared mouse mammary fat pad reconstituted using 1000 of CD49fhigh/CD24med cells (top); the same number of CD49fhigh/CD24med-depleted cells failed to reconstitute the fat pad (bottom). (C) Phase-contrast images of CD49fhigh/CD24med and CD49fhigh/CD24med-depleted cells. (D) The expression levels of the mRNAs encoding E-cadherin, N-cadherin, vimentin, Slug and Twist in the CD49fhigh/CD24med relative to CD49fhigh/CD24med-depleted cells, as determined by Real-time RT-PCR. GAPDH mRNA was used to normalize variability in template loading. The data are reported as mean +/− SEM. (E) CD44high/CD24low cells (R4) and CD44low/CD24high cells (R3) were isolated from human reduction mammoplasty tissues using FACS. (F) The expression levels of the mRNAs encoding E-cadherin, N-cadherin, SIP-1 and FOXC2 in CD44high/CD24low cells (R4) relative to CD44low/CD24high cells (R3), as determined by Real-time RT-PCR. GAPDH mRNA was used to normalize the variability in template loading. The data are reported as mean +/− SEM. (G) Heat map depicting the expression levels of mRNAs encoding EMT markers in CD44high/CD24low cells compared to CD44low/CD24high cells, as determined by SAGE analysis. Red and green squares correspond to high and low mRNA levels, respectively.

