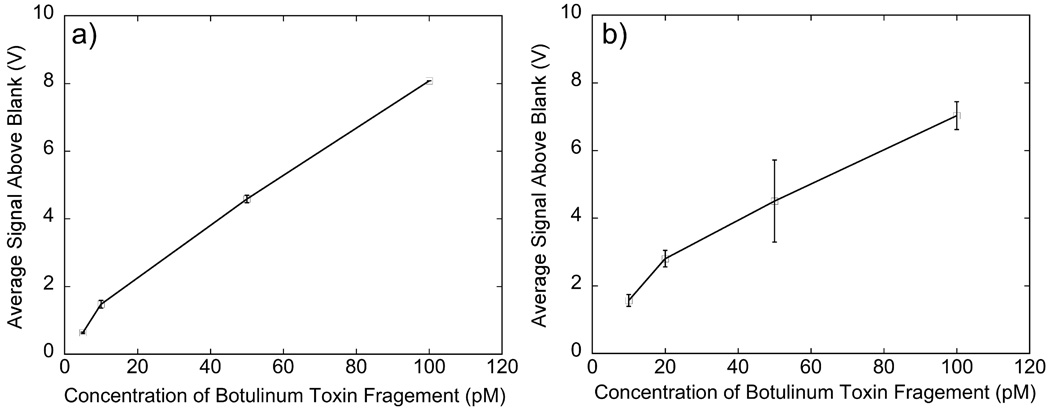
Figure 6.
Calibration curve for the detection of BoNT/A-Hc fragment in a) PBS buffer and b) FBS using a bead based sandwich immunoassay with 655 nm quantum dots and detection on an in house flow system. Each point represents the average of the difference in response between the sample and the blank of three samples at that concentration. The standard deviation of the blank (not shown) was determined to be a) ± 0.047 V for PBS and b) ± 0.078 V for FBS.

