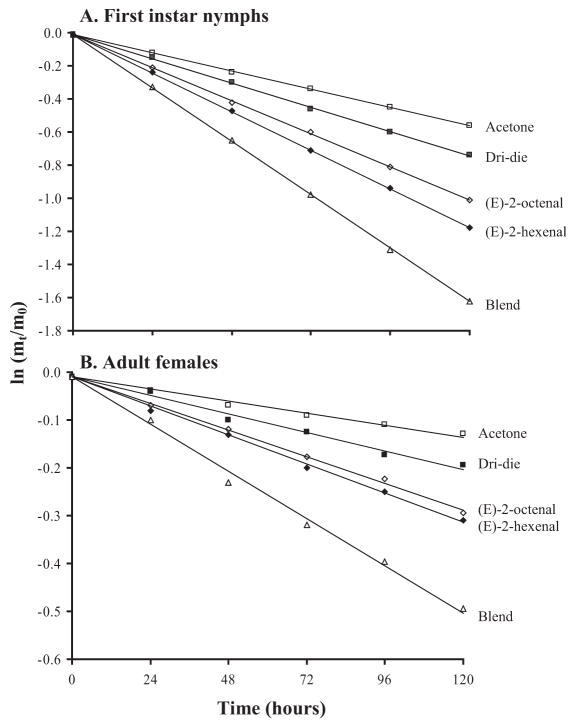
Fig. 1.
Proportion of water mass lost at 0% RH, 25°C by (A) first-instar nymphs and (B) adult females of C. lectularius after 10-min exposure to Dri-die (label rate) with and without alarm pheromone added. At 0% RH conditions, the slope of the regression through the points on the semilog plot is the net transpiration rate (integumental plus respiratory water loss). mt, water mass at any time t; m0, initial water mass. Each point is the mean of 45 bugs, and the SEs lie within the confines of symbols used on the graph. Data shown are for 0.01 M of alarm pheromone, the concentration showing the greatest effect.

