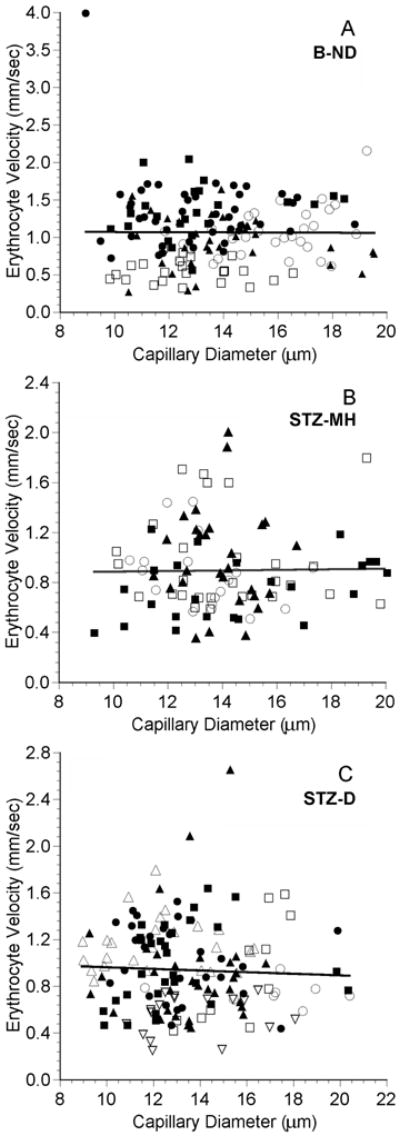
Figure 3.

Erythrocyte (RBC) velocity as a function of diameter in the choriocapillaris in five B-ND rats (A), four STZ-MH rats (B), and seven STZ-D rats (C). In each panel, each symbol represents a single capillary path, and each symbol type represents values from an individual rat. The line in each plot is the linear regression for the data from all of the rats. A: RBC velocity = -0.00132 (diameter) + 1.082, n = 153 capillaries in 5 rats, r = 0.007, p = 0.933. B: RBC velocity = 0.00235 (diameter) + 0.861, n = 98 capillaries in 4 rats, r = 0.016, p = 0.876. C: RBC velocity = - 0.00690 (diameter) + 1.030, n = 153 capillaries in 7 rats, r = 0.046, p = 0.574. Note that there are different scales on the axes.
