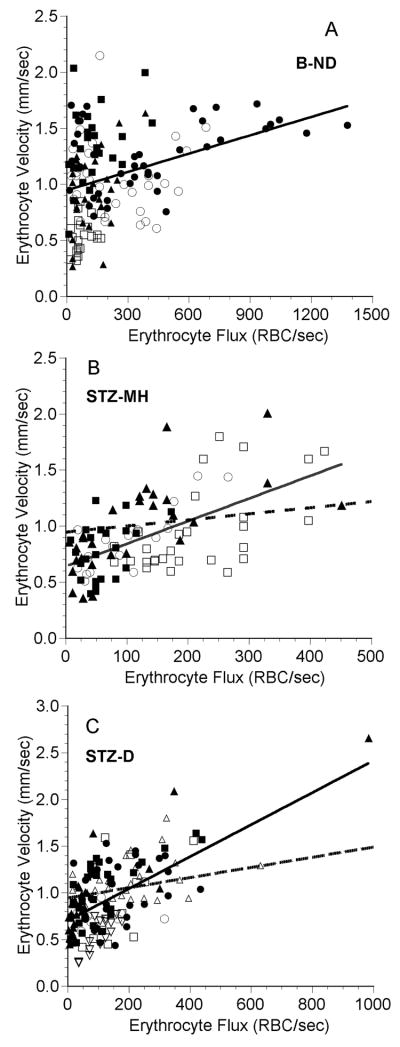
Figure 4.
Erythrocyte velocity as a function of erythrocyte flux in the choriocapillaris in five B-ND rats (A), four STZ-MH rats (B), and seven STZ-D rats (C). Each symbol represents a single capillary path, and each symbol type represents values from an individual rat. The solid line in each plot is the linear regression for the data from all of the rats. In panels B and C, the dashed line is the regression line from panel A. A: RBC velocity = 0.000545 (RBC flux) + 0.946, n = 153 capillaries in 5 rats, r = 0.291, p < 0.001. Point at (76.9, 3.98) not shown for clarity. B: RBC velocity = 0.00202 (RBC flux) + 0.638, n = 98 capillaries in 4 rats, r = 0.600, p < 0.001. C: RBC velocity = 0.00171 (RBC flux) + 0.700, n = 153 capillaries in 7 rats, r = 0.610, p < 0.001. Note that there are different scales on the axes.

