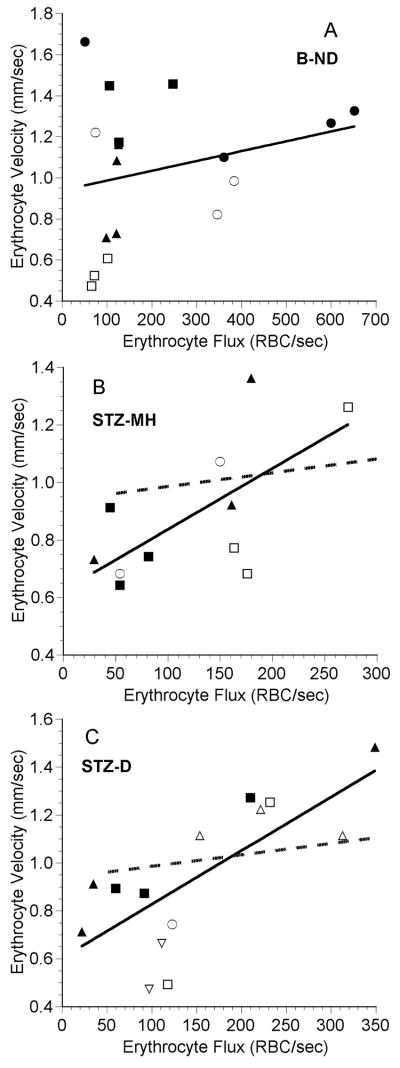
Figure 5.
Mean erythrocyte velocity as a function of mean erythrocyte flux in fields of choriocapillaris vessels in five B-ND rats (A), four STZ-MH rats (B), and seven STZ-D rats (C). Each symbol represents the mean value from an individual capillary field, and each symbol type represents values from an individual rat. The line in each plot is the linear regression for the data. In panels B and C, the dashed line is the regression line from panel A. A: RBC velocity = 0.000467 (RBC flux) + 0.937, n = 17 capillary fields in 5 rats, r = 0.254, p = 0.324. B: RBC velocity = 0.00214 (RBC flux) + 0.623, n = 11 capillary fields in 4 rats, r = 0.664, p = 0.026. C: RBC velocity = 0.00224 (RBC flux) + 0.602, n = 17 capillary fields in 7 rats, r = 0.737, p < 0.001. Note that there are different scales on the axes.

