Table 2.
Aggregation equilibrium constants of lithium and cesium enolates. The structure of the lithium enolate is shown. Values for cesium enolates are given in italics.
| Li Enolate | K1,2 M−1 | K1,4 M−3 | [M] in 1Ma | pK |
|---|---|---|---|---|
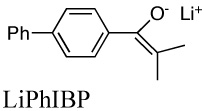 |
5.0E+8e | 0.0047 | 15.9 | |
| 2.9E+4d | 7.8E+12 | 25.1 | ||
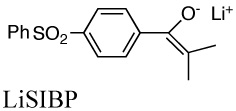 |
5.0E+4b | 0.0032 | 14.7 | |
 |
4.2E+2c | 0.034 | 11.6 | |
| 3.5E+3 | 18.1 | |||
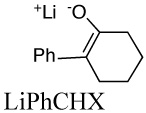 |
2.8E+3f | 0.013 | 12.7 | |
| 1.8E+3 | 19.8 | |||
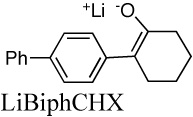 |
4.3E+3g | 0.011 | 12.6 | |
| 1.9E+3h | 19.3 | |||
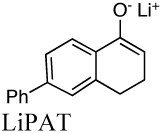 |
4.7E+10i | 0.0015 | 14.2 | |
| 2.3E+11k | 23.4 | |||
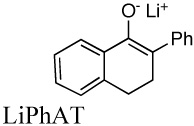 |
1.9E+3j | 0.016 | ||
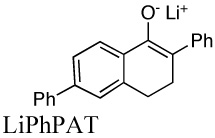 |
2.65E+3i | 0.014 | 11.1 | |
| 1.8E+3 | 17.8 | |||
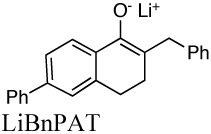 |
3.8E+3i | 0.011 | 14.0 | |
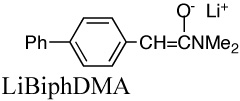 |
4.5E+2l | 0.033 | 19.8 | |
| 4.7E+2m | 24.9 | |||
