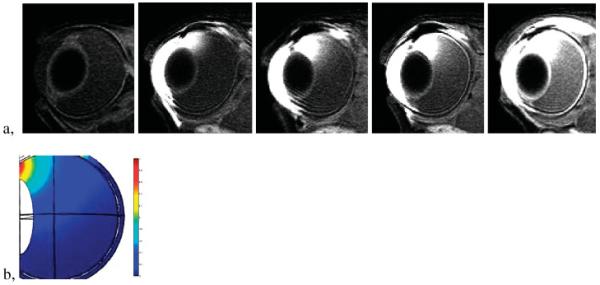
Figure 3.

Distribution of Mn2+ in the eye after 20 min of 3 mA transscleral iontophoresis applied on the sclera next to the limbus: (a), from left to right, control and at 1, 2, 3, and 11 h after iontophoresis application; (b) model simulation result of a finite element method using Comsol (Burlington, MA, USA) mimicking the 3 h MRI data. The MRI scans were performed with a 3 T Siemens clinical scanner.
