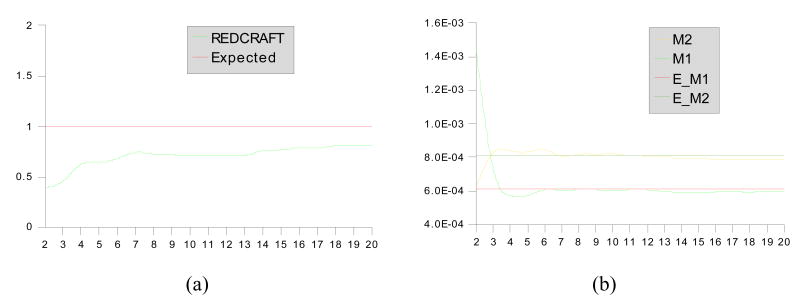
Figure 6.
Results of REDCRAFT for residues 1–20 of 1A1Z (static region). Panel (a) demonstrates the structural fitness as a function of increasing fragment size and (b) demonstrates the value of GDO as a function of increasing fragment size. The values M2, M2, E_M1 and #_M2 in panel (b) corresponds to value from M2, value from M1, Expected M1 and Expected M2 values respectively.

