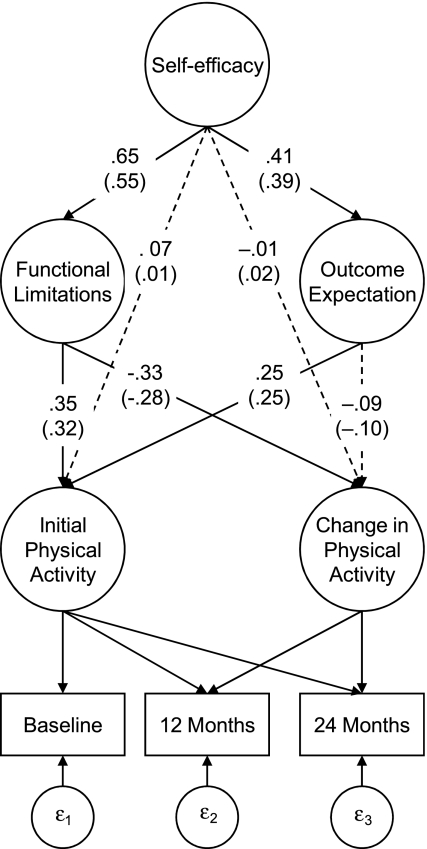
Figure 2.
Predicting declines in physical activity across 24 months using social cognitive variables. Note that values in parentheses are path coefficients adjusted for age, income, race, education, and number of reported chronic health conditions. All loadings are standardized, and significant paths are shown by solid lines. Nonsignificant paths are indicated by dashed lines.

