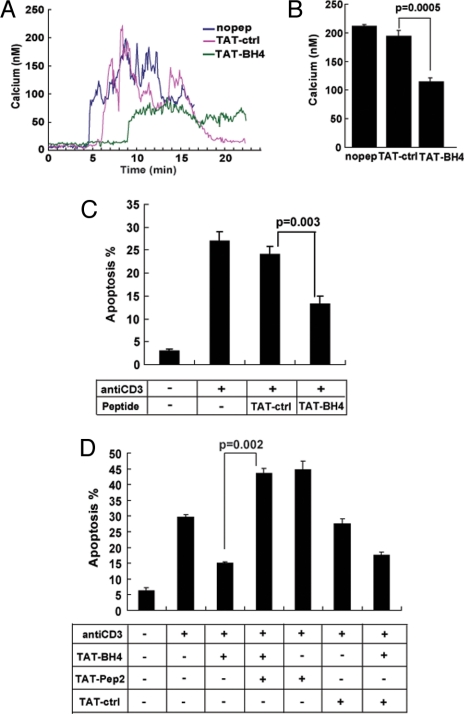
Fig. 4.
Inhibition of anti-CD3-induced apoptosis by TAT-BH4 and reversal by TAT-Pep2. (A) Representative Ca2+ traces recording the Ca2+ elevation induced by 5 μg/ml anti-CD3 antibody in Jurkat cells in the presence of 2 μM TAT-ctrl or TAT-BH4 peptides. Anti-CD3 was added 1–2 min after recording was started. (B) Histograms summarize the average peak anti-CD3 induced Ca2+ elevation in Jurkat cells treated with various peptides (mean ± SEM of four- individual experiments, >50 cells per sample per experiment). (C) TAT-BH4 or TAT-ctrl peptides were added at 1-μM final concentration 1 h before and 15 h after adding 5 μg/ml anti-CD3 antibody. Symbols represent the percentage of Hoechst 33342–stained cells displaying morphology typical of apoptosis 24 h after anti-CD3 addition (mean ± SEM; >200 cells counted per coverslip). (D) TAT-Pep2 reverses TAT-BH4-mediated inhibition of anti-CD3–induced apoptosis. Jurkat cells were incubated with or without TAT-BH4, and apoptosis was induced by anti-CD3 antibody as described in (C). Also, some of the cell suspensions were co-treated with 10 μM TAT-Pep2 or TAT-ctrl, added 1 h before anti-CD3 antibody, as outlined in the accompanying diagram. Symbols represent the percentage of cells (mean ± SEM) with apoptotic nuclei in four experiments (>200 cells counted per coverslip).

