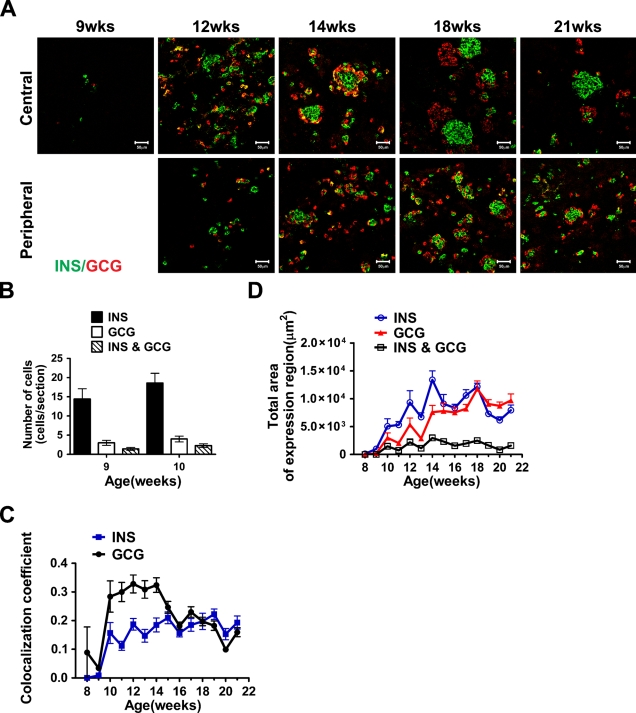
Figure 2.
Coexpression of insulin and glucagon during human pancreas development. (A) Immunostaining of human fetal pancreas with anti-insulin (green) and anti-glucagon (red) antibodies. Cells coexpressing insulin and glucagon appear in yellow. Tissue sections were obtained from the central or peripheral areas of the fetal pancreas as indicated. Numbers indicate the gestational age in weeks (wks). Bar = 50 μm. (B) Quantification of the insulin, glucagon, or double-positive cells (as detected by immunostaining) in 9- and 10-week fetal pancreas. (C) Colocalization index for insulin and glucagon. Images of immunostained fetal pancreas, using anti-insulin and anti-glucagon antibodies, were analyzed. Values indicate the ratio between double- and single-stained cells. (D) Total area of insulin- or glucagon-expressing cells.

