Figure 3.
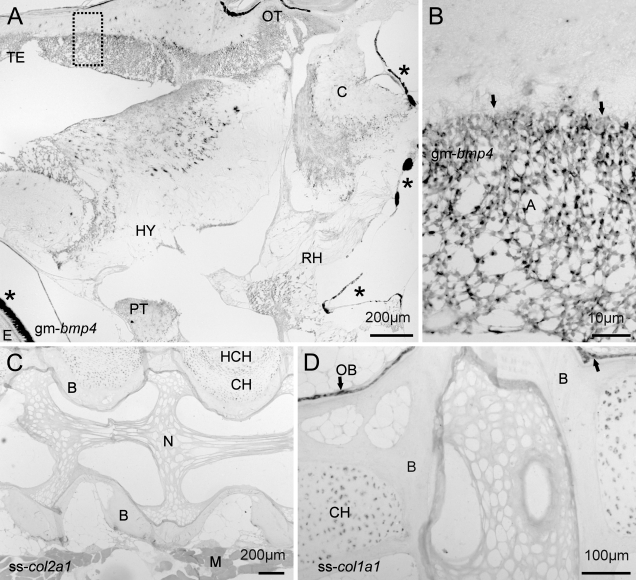
ISH analysis on sagital sections (6 μm) of fish bony tissues. (A) Mosaic image of a cod brain with bmp4-positive cells in various brain structures (dorsal upwards). A small part of the eye (E) is visible in the lower left corner. The asterisks indicate pigmented melanocytes in the eye and hindbrain and are not unspecific background. (B) Magnification of the stippled rectangle showing abundant bmp4 expression in astrocytes in the molecular layer (arrows). (C) Expression of col2a1 in chondrocytes at the dorsal side of the vertebra. (D) Expression of col1a1 in chondrocytes and the bone-forming osteoblasts adjacent to the ossified bone. No coloration was visible on control sections with the corresponding sense probes. Arrows indicate osteoblasts (OB). TE, telencephalon; C, cerebellum; OB, osteoblasts; OT, optic tectum; RH, rhombencephalon; PT, pituitary; E, eye; HY, hypothalamus; A, astrocytes; B, ossified bone; N, notochord; CH, chondrocytes; HCH, hypertrophic chondrocytes; M, muscle.

