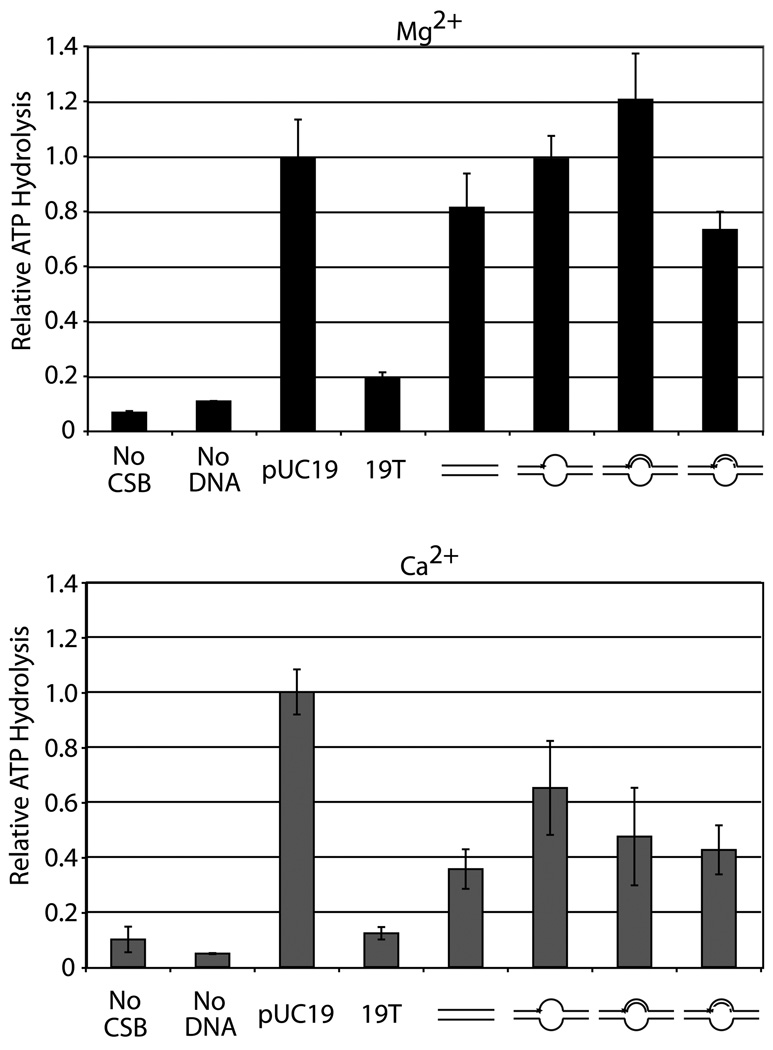
Fig. 2. Alternate model nucleic acid substrates serve as cofactors for CSB dependent ATP hydrolysis in the presence of Mg2+ (top) or Ca2+ (bottom).
CSB ATPase assays were performed as described in Experimental Procedures. Average relative values (to pUC19 reaction under each metal condition) are plotted with standard deviations of at least 3 independent experiments. Substrate depictions are displayed underneath each graph: from left to right pUC19, 19T, 34G/34C, 54FE/54C, 54FE/54C/18D, and 54FE/54C/18R. Solid lines represent DNA and dashed lines represent RNA. (see Table 1 for oligonucleotide details).

