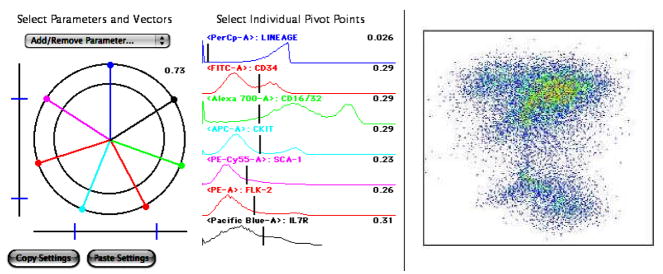
Figure 5. Polyvariate Plot.
The mouse bone marrow sample described in Figure 4 was re-plotted as a 7 vector FlowJo Polyvariate plot. Vectors are arranged in a star pattern to provide identification of each monoclonal antibody -fluorochrome combination around a common central point. The arrangement of these fluorochrome conjugated antibodies is displayed by the colored lines displayed around a central point, and the histogram pivot range is displayed by colored histograms. The resulting Polyvariate Plot demonstrates the correlation of all seven parameters on one 2-dimensional plot, rather than numerous bivariate plots.

