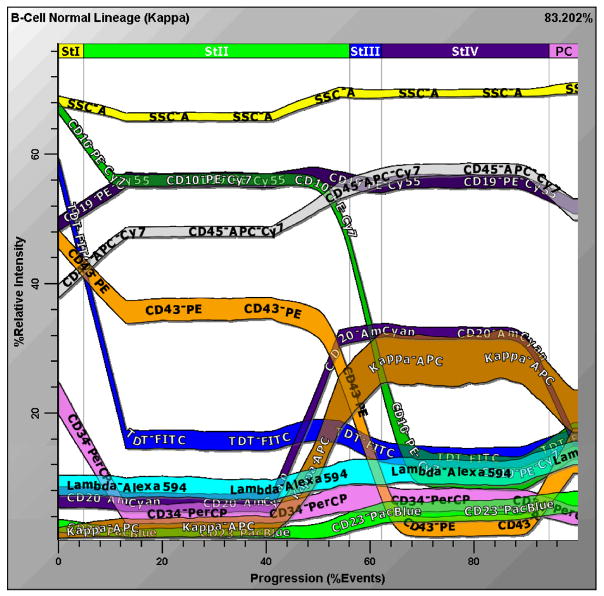
Figure 6. Probability State Model of Human B-Cell Maturation.
Human bone marrow was stained with titered volumes of CD23-Pacific Blue, CD20-AmCyan, TdT-FITC, CD34-PerCP, CD43-PE, CD19-PeCy5.5, CD10-PECy7, Kappa –APC, CD45-APCCy7and Lambda- Alexa 594. Approximately 10,000 cells were analyzed and depicted in this Figure. The percentage of cells in each ‘state’ can be measured along the x-axis, and the level of antigen expression measured along the y-axis, where discreet colors are assigned to each parameter. B-cell precursors are seen to be down-regulating ‘early’ markers like CD34 and TdT and up-regulating more ‘mature’ antigens like CD20, CD23 and surface immunoglobulin light chain. These correlated variations are intuitively comprehensible since they are similar to the way a user might diagram the data. In contrast to the necessity of numerous conventional bivariate plots, Gemstone™ concisely depicts all these relationships in one plot.

