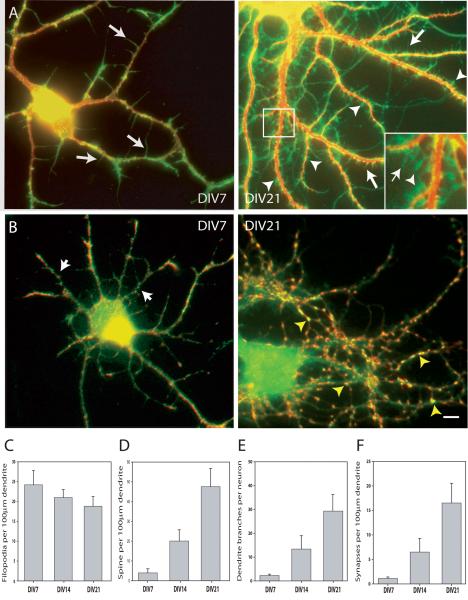
Figure 1. Changes in the relative number of filopodia, spines, dendrite branches and synapses during development in culture.
(A) Fixed hippocampal neurons were immuno-stained for γ-actin (green), to visualize filopodia and spines and MAP2 (red) to highlight the dendritic arbor. Examples shown here are at 7 days in vitro (DIV) and 21 DIV. Arrows indicate examples of filopodia; arrowheads indicate examples of spines. The inset in the right-hand panel is an ∼ 3-fold enlargement of the boxed area. (B) Fixed hippocampal neurons were immuno-stained for PSD-95 (green), to visualize post-synaptic sites and synaptogamin (red) to highlight the pre-synaptic boutons. Overlapping puncta of PSD-95 and synaptotagmin (yellow) were considered to be synapses. Examples shown here are at 7 DIV and 21 DIV. Yellow arrowheads indicate examples of synapses. Arrows indicate examples or PSD-95 puncta without overlapping synaptotagmin puncta. Bar = 10 μm. (C) Graph illustrating the number of filopodia /100μm dendrite length comparing DIV 7, 14 and 21 hippocampal neurons (n=100 dendrites at least 100 μm long, from at least 25 separate neurons at DIV7, 14 or 21; 3 separate experiments). As the neurons mature, the density of filopodia declines. (D-F) Graphs illustrating the number of spines /100μm dendrite length (D), dendritic branches per neuron (E) and the number of synapses /100μm dendrite length (F), comparing DIV 7, 14 and 21 hippocampal neurons. In C, D and F, n=100 dendrites at least 100 μm long from at least 25 separate neurons at DIV 7, 14 or 21; 3 separate experiments. In E, n= at least 25 neurons at DIV 7, 14 or 21; 3 separate experiments). As the neurons mature, the density of synapses increases 15 fold, similar to the increase observed with spines, while branching of the dendritic arbor increases markedly. All data bars represent the mean ± SEM.

