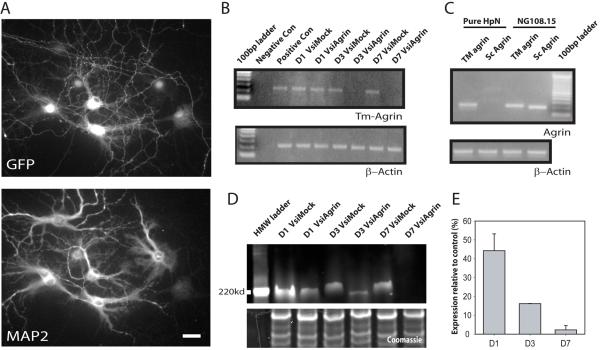
Figure 2. Demonstration of effectiveness of the shRNA-producing lentivirus in suppression of Tm-agrin expression in hippocampal neurons.
(A) Immunofluorescence image of infected hippocampal neurons, immuno-stained for GFP to indicate viral infection and MAP2 to distinguish neurons. The lentivirus infected >95% of neurons, albeit with variable expression of GFP. Bar = 50 μm. (B) Semi-quantitative RT-PCR demonstrates the effectiveness of the shRNA (VsiAgrin) in knocking down endogenous Tm-agrin message expression. Densitometry of the bands in 3 separate experiments showed that the Tm-agrin message was reduced by ∼15% at 1 day post infection (D1), and by almost 100% at D3 and D7, while the mock shRNA (VsiMock) did not effect expression. RT-PCR for β-actin was used to demonstrate that equal amounts of cDNA were used. (C) Semi-quantitative RT-PCR from RNA isolated from either hippocampal neurons or from a neuroblastoma-glioma hybrid cell line, NG108-15, using isoform-specific oligos shows that hippocampal neurons in culture express only the transmembrane form of agrin. (D) To demonstrate the loss of Tm-agrin protein after suppression of the message, we over-expressed dsRed monomer-Tm-agrin in hippocampal neurons, and after 14 DIV infected with either VsiAgrin or VsiMock, then determined Tm-agrin protein levels via Western blots using a dsRed antibody (example shown here). The lower box shows the Coomassie stained lower half of same gel used for Tm-agrin blotting, demonstrating equal protein loading. The small apparent discrepancy in mobility between the VsiAgrin- and VsiMock-treated protein bands probably reflects differences in glycosylation level as well as the differences in concentration of Tm-agrin protein caused by VsiAgrin treatment. (E) Quantitative analysis of blots taken from 4 different experiments show that the relative DsRed Tm-agrin protein levels had dropped by 45% at D1, 85% at D3, and almost 100% at D7, compared to VsiMock. Bars show the mean ± SEM.

