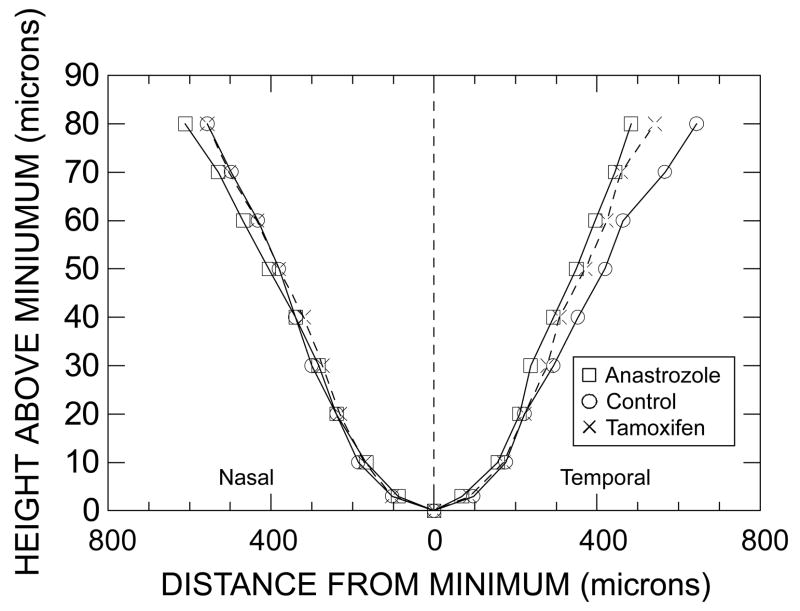
Figure 1.
Graph of the height above the minimal foveal thickness (i.e., of the degree by which the thickness of the fovea at a given locus exceeds the minimal thickness) vs. the lateral distance from the locus of minimal thickness to the foveal slopes in the nasal (left) and temporal (right) directions. Squares (□) represent median data of anastrozole users, circles (○) represent median data of control subjects, and crosses (×) represent median data of tamoxifen users. Connecting lines are unbroken for the anastrozole users and control subjects, and are dashed for the tamoxifen users. Although heights vary along the ordinate and the distances vary along the abscissa, distance is the dependent variable. Data at a height of 90 μm are not included since the maximal height on the temporal side was < 90 μm for 10 of 56 subjects. All units are in microns (μm). Note that the scales on the two axes differ. The locus of minimal thickness itself defines a height of 0 μm. Non-PVD subjects only.

