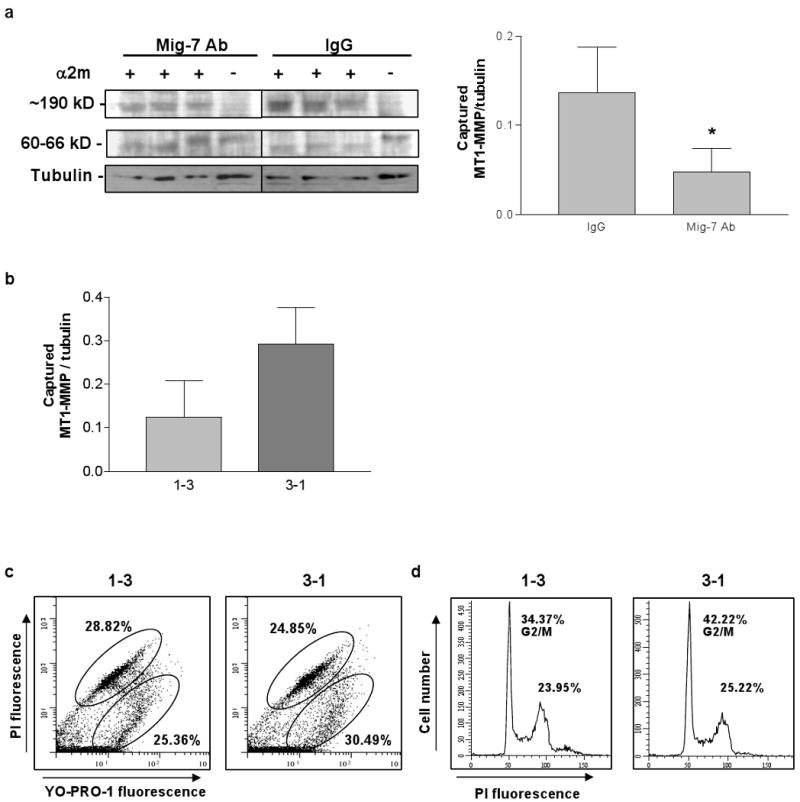
Figure 2.

Antibody or expression of shRNA specific to Mig-7 decreases activity of MT1-MMP. (a) Representative immunoblot and densitometry results for α2-macroglobulin capture assay of active MT1-MMP in lysates from equal numbers of HEC1A cells treated with normal rabbit IgG or with Mig-7 antibody. All samples were run on the same gel. Mig-7 antibody treatment significantly decreased MT1-MMP activity by 70% compared to IgG treatment (p=0.0496). Densitometry data are for the upper, captured MT1-MMP band in each lane normalized to its respective tubulin band. Bars represent SEM. (b) Densitometry analysis of the upper, captured MT1-MMP band from α2-macroglobulin capture assay in lysates from RL95 cells stably transfected with shRNA 1-3 (decreased Mig-7 expression) and 3-1 (control, endogenous levels of Mig-7 expression). Results are normalized to β-tubulin. RL95 cells expressing shRNA 1-3 showed a 57% decrease in MT1-MMP activity compared to 3-1 control cells. Bars represent SEM. (c) Representative flow cytometry histograms of RL95 shRNA 1-3 and 3-1 stably transfected cells stained with YO-PRO-1 and propidium iodide (PI). YO-PRO-1 single positive cells (lower oval) were apoptotic, and double positive cells (upper oval) were dead. Mean percentages of three samples are shown. (d) Representative flow cytometry histograms of RL95 shRNA 1-3 and 3-1 stably transfected cells stained with propidium iodide for cell cycle analysis. Cells in G2/M phase are indicated on histograms. Mean percentages of three samples are shown. Flow cytometry experiments were conducted twice with similar results.
