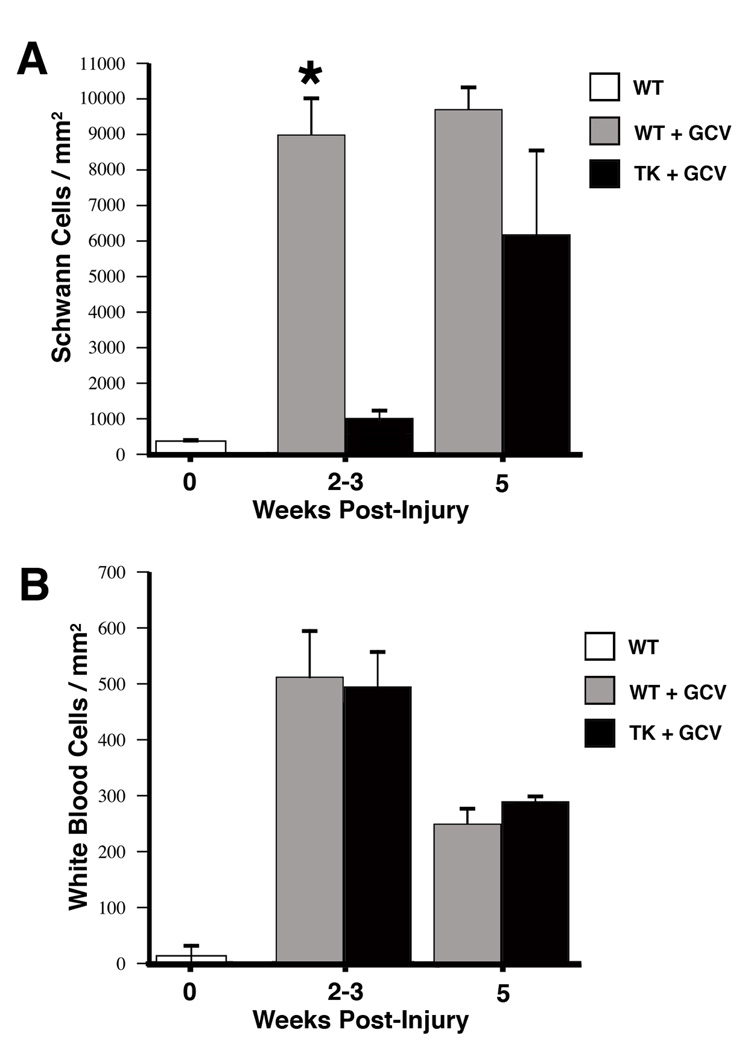
Figure 2.
Counts of the number of Schwann cells (A) and white blood cells (B) in 1µm plastic-embedded sections in distal nerve at various times post-injury following continuous GCV administration during the first 7-days. Data expressed as mean ± SEM per mm2, N=4 TK animals and N=4 WT animals at each time point. A, top panel: There is a rapid and dramatic increase in the number of Schwann cells in WT animals compared to uninjured controls by 2–3 weeks, representing a greater than 15-fold. A similar increase (11-fold) in TK animals is not seen until 5 weeks post-injury and represents the ingrowth of Schwann cells from the proximal nerve that accompany regenerating axons. *=p<.05 between WT and TK. B, bottom panel: In contrast to the dramatic differences in the number of Schwann cells between WT and TG animals, there are no differences in the number of inflammatory cells (white blood cells). Compared to uninjured controls, both experimental groups show significant increases in the number of white blood cells typical of Wallerian degeneration.

