
Fig. 5.
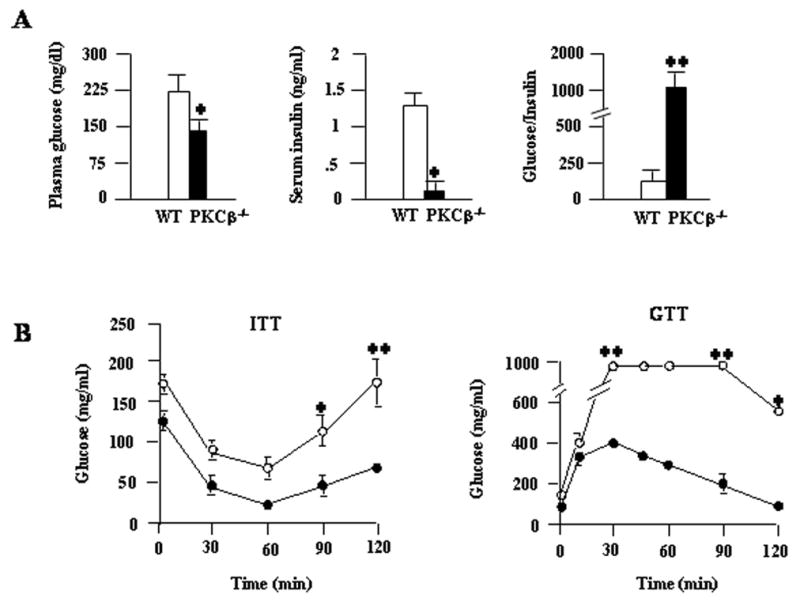
Increased in vivo insulin sensitivity in the PKCβ−/− mice compared to WT mice following 12 weeks of a HFD. (A) Plasma glucose and plasma insulin were measured after 12 weeks on a HFD in WT and PKCβ−/− mice. Data are means±S.D. (n=8). (*, P<0.05). (B) Changes in glucose levels in insulin tolerance tests (ITT) (left panel) and glucose tolerance tests (GTT) (right panel). For ITT, mice fasted for ~16 h were injected with insulin (0.75 units/kg of body weight), blood samples were obtained at the indicated times, and glucose levels were monitored. For GTT, mice fasted for ~16 h were injected with a bolus of glucose, and blood samples were obtained at the indicated time and analyzed for glucose levels. Data are means±S.D. (n=6). *, P<0.05; **, P<0.001.