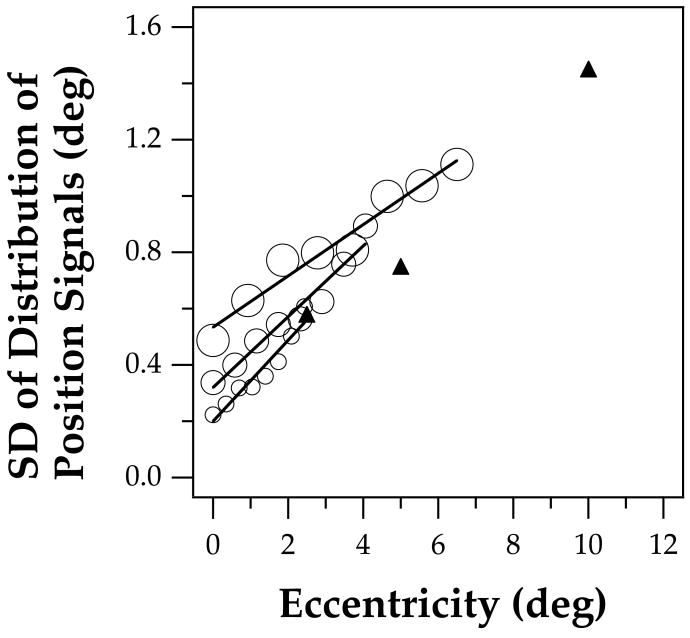
Figure 10.
The SD of the intrinsic blur (in deg) for localizing peripherally presented Gaussian or Gabor patches is plotted as a function of stimulus eccentricity (black triangles; data replotted from Levi & Tripathy, 1996). For comparison, the estimated SD of the distribution of letter position coding as reported in Figure 8, converted to degrees, is plotted as a function of letter position, converted to eccentricity in degrees, for the three letter sizes (open circles). Straight lines represent the model predictions. The data for localizing Gaussian or Gabor patches follow the trend of our model predictions reasonably well.

