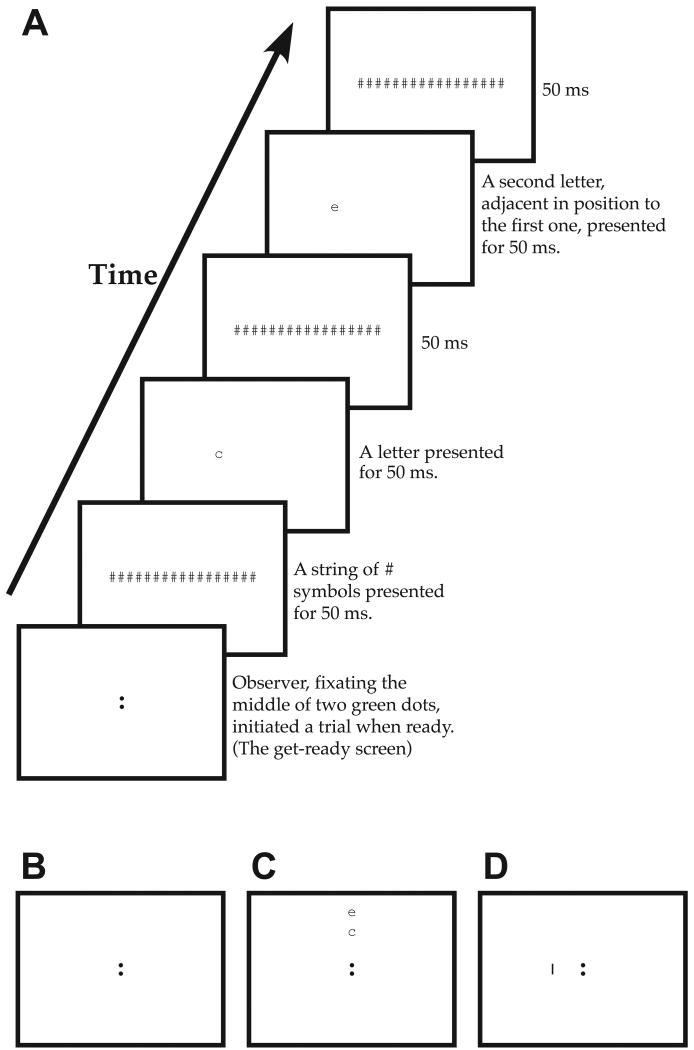
Figure 2.
(A) A schematic cartoon depicting a sample trial for the different testing conditions. The stimulus letters, from left to right, were “ec”. (B–D) The different looks of the get-ready screen before the observer initiated a trial. In (B), only the pair of fixation dots (green in the actual experiment) was shown. (C) Experiment 1: The two target letters in the upcoming trial were presented above the pair of fixation dots before the trial. The relative position of the two letters was random and did not indicate the spatial or temporal order of the two letters in the trial. (D) Experiment 2: A short green vertical line indicating the mid-point of the two letters in the upcoming trial was shown. This green line served as the precue.

