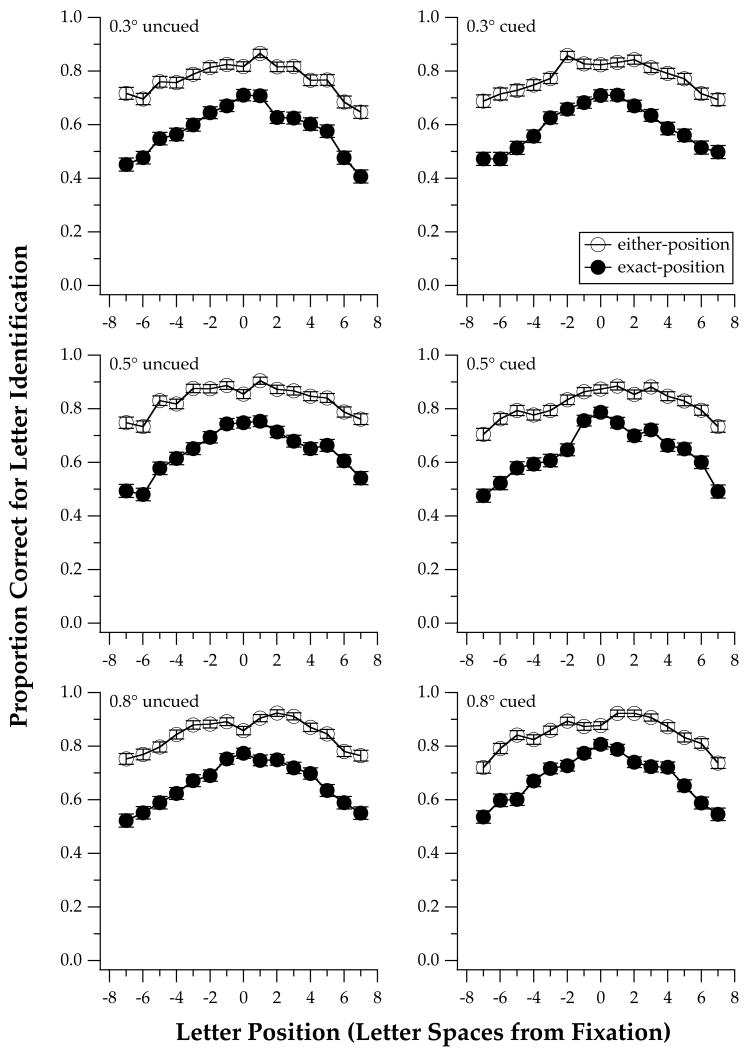
Figure 6.
Proportion correct for letter identification, combined across the six observers, is plotted as a function of letter position from fixation (negative values: left of fixation; positive values: right of fixation), for the three letter sizes (0.3°, 0.5° and 0.8°) and the uncued/cued conditions. The two curves in each panel represent the same set of data scored by the exact and the either-position methods.

