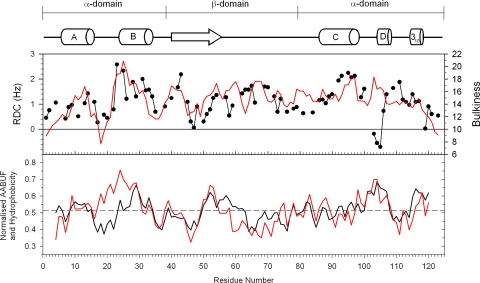
Fig. 5.
a Experimental RDCs recorded for all-Ala α-LA in 10 M urea (black) are compared with the bulkiness profile (red) calculated as described by Cho et al. (2007). b Normalised values for all Ala α-LA of the average area buried upon unfolding (AABUF) (black) (Rose et al. 1985) are compared with the hydrophobicity using the Abraham & Leo scale (red) (Abraham and Leo 1987). All values were averages over 7-residue windows. The dashed grey line shows the mean value of AABUF and hydrophobicity

