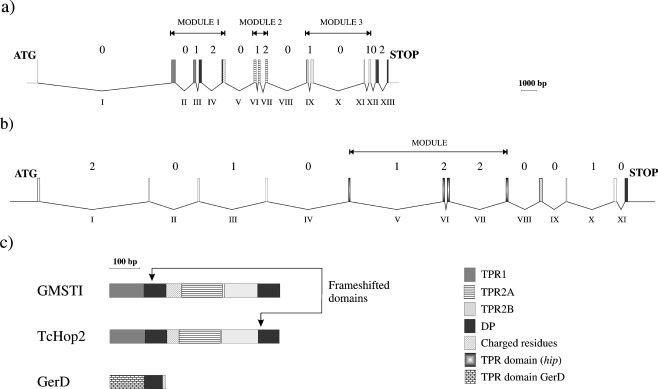
Fig. 2.
Schematic representation of the human hop (a) and hip (b) genes, at the same scale (in base pairs). Rectangles symbolize the various exons coding for TPR1, TPR2A, TPR2B, and DP domains; grey code is given in the onset. Introns located in between the exons are represented by broken lines. Arabic numbers indicate the phase of each intron and Latin numbers indicate introns. The extent of the modules is indicated by horizontal lines. In (c), the various domain distribution is represented for GmHop, TcHop2, and GerD

