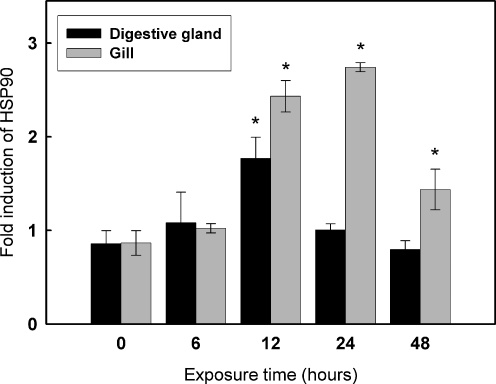
Fig. 5.
Relative leHSP90 mRNA expression levels at different time points after heat treatment. Transcript levels for all samples were assessed by semiquantitative RT-PCR with SYBR Green, and the relative expression levels of leHSP90 were obtained relative to β-actin expression. Values are expressed as means ± SD of the relative variations (fold induction) between each treatment (10°C) and the control sample (1°C); asterisks above the bars indicate statistically significant differences (*P < 0.05)

