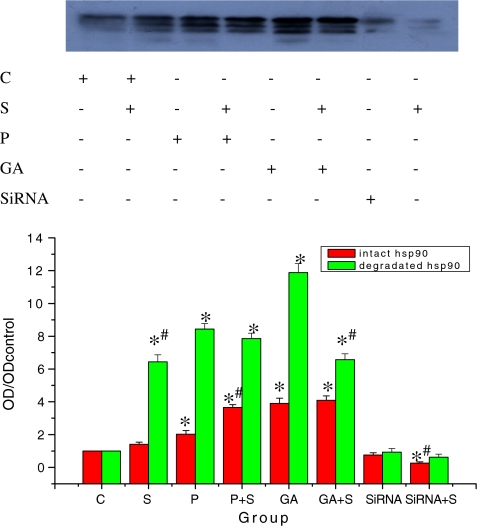
Fig. 2.
Effect of Hsp90 on cell cycle distribution of HepG2 cells. Adherent growing HepG2 cells were kept either untreated or were irradiated (500 μM H2O2, 24 h). Immediately after oxidative stress, cells were lysed and intact and degraded Hsp90 was assayed by Western blotting using anti-Hsp90 (Stressgen, SPA-840). Equal amounts (20 μg) of protein were loaded. The signal intensity obtained from HepG2 cells without added GA was arbitrarily set to 1.0 (control). Quantitative data represent averages of three experiments (mean ± SE; *, #p < 0.05; asterisk each group vs control; number sign: with oxidative stress vs without oxidative stress)

