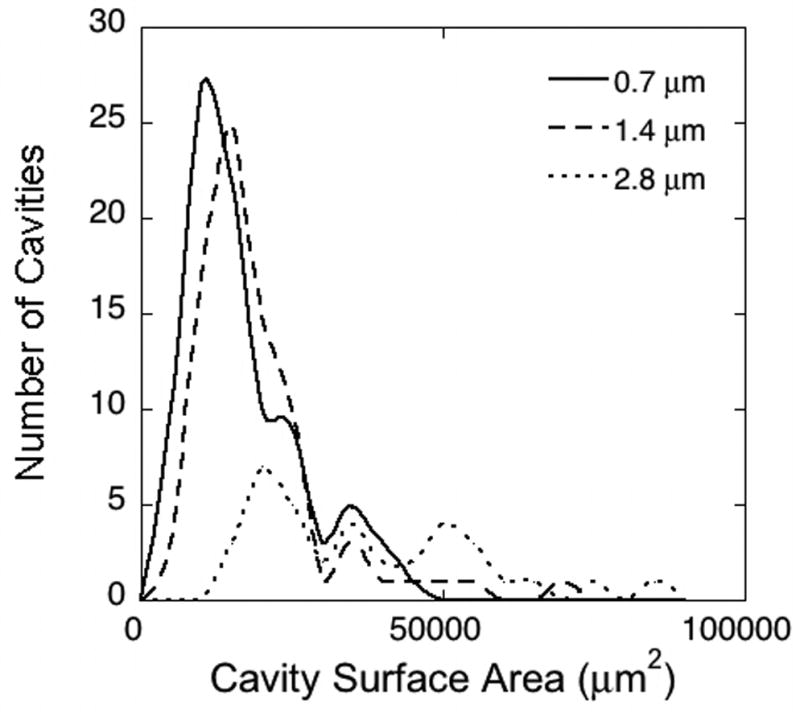
Figure 4.

Histograms showing the distribution of cavity surface size for three different image resolutions (identified by in-plane pixel size). Cavities observed in 0.7 μm and 1.4 μm images showed a similar size distribution, while cavities observed in lower resolution images (2.8 μm shown here) were less numerous and were larger in surface size.
