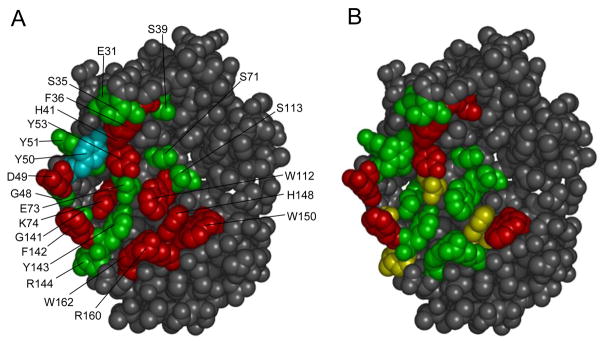
Figure 4.
Structure of BLIP with randomized residues highlighted. Panel A summarizes the results from alanine scanning of BLIP and measurement of binding to TEM-1 β-lactamase 28. Residues colored red represent positions where the alanine substitution resulted in a greater than 10-fold loss in binding affinity. Residues colored green represent positions where an alanine substitution had a less than 10-fold effect on binding and the residue colored cyan represents a position where the alanine substitution resulted in a greater than 10-fold increase in binding affinity 28. In Panel B the results of the saturation mutagenesis studies are summarized. Positions where 2 or less amino acids substitutions (including wild type) are consistent with function are colored red. Positions where 4 or less amino acids are consistent with function are colored yellow. Positions were greater than 4 amino acid substitutions are consistent with function are colored green.

