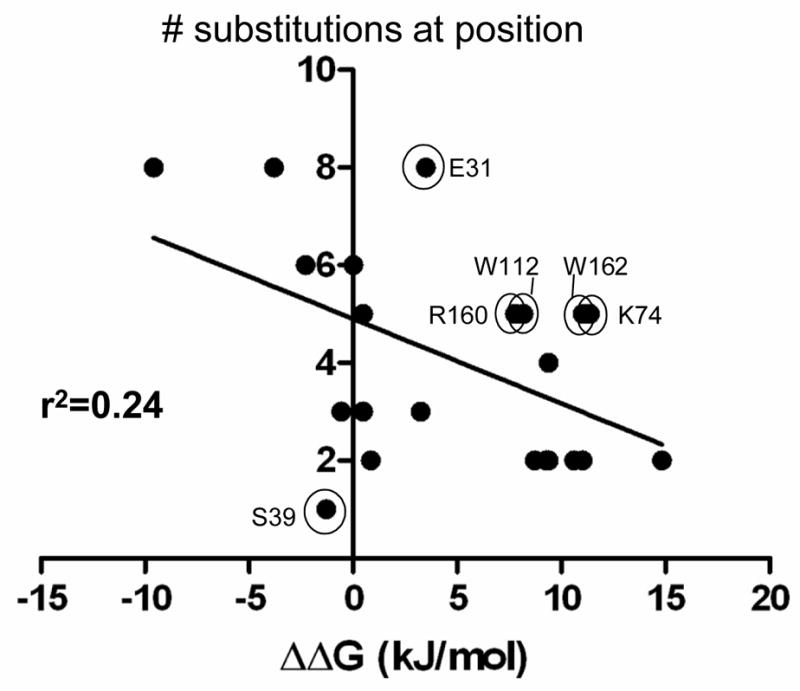
Figure 5.

The graph shows the correlation between the randomization and selection results and the ΔΔG values of the alanine scanning mutants at the same positions using Ki data from Zhang and Palzkill 28. Each data point represents one of the 23 residues randomized and shown in Fig. 3. The X-axis indicates the ΔΔG (kJ/mol) values for the BLIP alanine mutants for binding TEM-1 β-lactamase 28. The Y-axis indicates the number of amino acids (including wild type) consistent with wild type levels of BLIP function in E. coli TP132 (top panel sequences in Fig. 3B). The circled and labeled positions are those where there is a lack of correlation between the alanine substitution result and the randomization result. For example, the W112 position exhibits a large loss of binding affinity when mutated to alanine suggesting the position is important for binding, however, five different amino acids can reside at residue 112 and provide high level function. r2 is the goodness of the linear regression fit of the indicated line.
