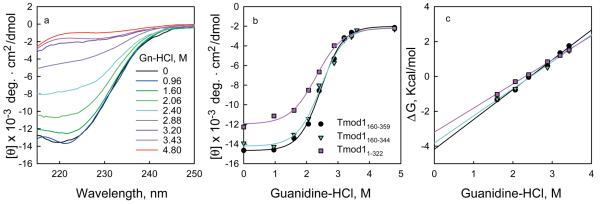
Figure 2. Determining the free energy of folding from changes in CD as a function of denaturant.
a, The mean residue ellipticity of three fragments of tropomodulin 11 as a function of Gn-HCl in 100 mM NaCl, 10 mM sodium phosphate, pH 6.5 at 10 °C. a, (black circles), Tmod1160-359, 0.24 mg/ml; (magenta triangles), residues Tmod1160-344, 0.17 mg/ml; (cyan squares), Tmod11-322, 0.22 mg/ml. The data were fit to equations 9-12 by non-linear least squares analysis. b, The data in panel a were transformed using equations 2, 3 and 5 to give a linear plot of ΔG as a function of denaturant. The free energy of folding equals the value of the y intercept.

